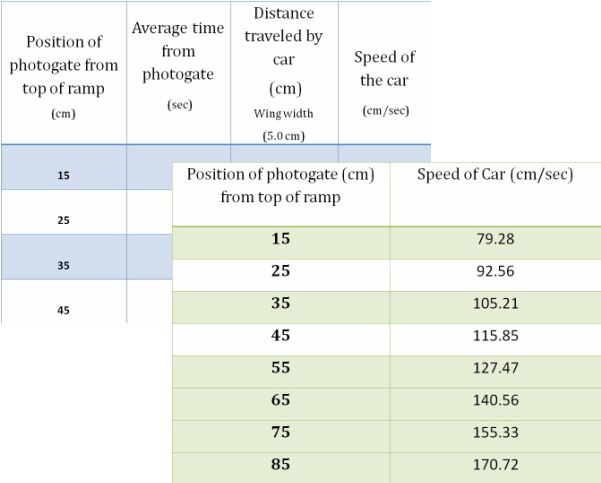
Above are two data tables for an experiment to determine if a relationship exist between the distance the car travels down the ramp and its speed. In this lab the independent variable would be the position of the photogate and the dependent variable would be the speed of the car.
The top data table will be used as we collect our initial data. The first column tells us the position of the single photogate we will use. The second column is the average in seconds of how long the car wing broke the beam of the photogate. The next column is the distance of the car wing. The last column is the calculated speed of the car.
The bottom data table has two columns. This represents the final data from the experiment. The first column is the distance of the photogate from the top of the ramp and the second is the calculated speed at each location.
The first two questions are related to the top data table
1. Why did we use an average for the seconds the car wing went through the photogate beam?
2. How did we calculate the speed of the car?
The next two questions are related to the bottom data table
1. Describe the pattern you observe in the data (relationship between distance of photogate and speed of car).
2. Predict the speed of a car if the photogate was 95 cm from the top. Explain your prediction.